
3× the accounts. Less than half the cost.
How Finom, a fintech platform for businesses across Europe, turned Meta into a stable acquisition channel by running its creative cycle on Loudbox.
Absolute budget, account volume and acquisition cost are withheld by agreement with the client. All figures are relative.
After the first half-year, CAC settles into a narrow band. Meta becomes plannable — and the variable that moves it is creative volume through the cycle.
1 — seasonal pause in buying; not a representative month. 2 — measurement methodology changed; not comparable to the months either side.
On Meta, creative is the targeting.
Growth comes from breadth. But breadth has to be precise.
The algorithm finds the audience through the creative: every new angle, format or character reaches a different pocket of users. More creative means more reach — not more budget.
But Finom sells business accounts to small businesses and freelancers, in a category where 67% of competitor creatives frame a card or a phone. When the target action is a business opening an account, volume alone burns budget. Every new creative needs a reason to exist.
So we calculate the optimal number of creatives for every cycle — scaling not just the quantity, but the precision.
The creative cycle, automated in Loudbox.
Every signal becomes the next creative.
The cycle was first run by hand. Once it proved itself, it moved into Loudbox, which ties performance data to the creative itself, element by element. The team still owns concepts and hypotheses; Loudbox shortens the path from signal to the next creative and puts data behind every decision.
Insights
Where do competitors show up — and we don’t? What matters to the audience?
Performance, engagement and competitor signals in one place, enriched with audience data and voice of customer. The same breakdown runs on competitor ads: 5,000+ designs on one map, plus an audience × angle matrix that shows the gaps.
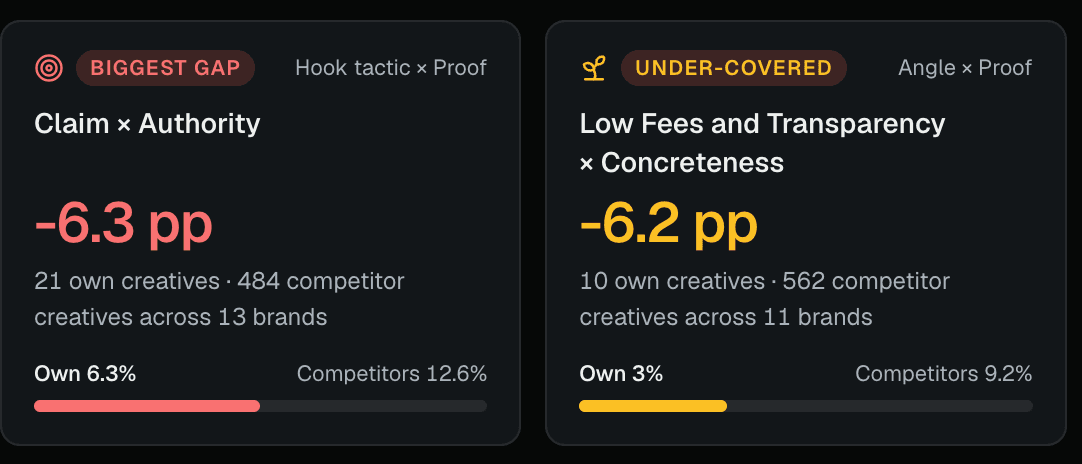
Gap cards: combinations the market uses far more than Finom did.
Elements
Not just what works — but why.
Computer vision breaks every creative into a fixed set of elements and links each one to accounts opened — by market, segment and product.
- Watch and listenVideos cut into ~13 key frames; speech and on-screen text logged as facts.
- ~35-point cardFixed choices, so thousands of creatives compare like for like.
- Evidence for every tagEach points to a frame or exact quote; unverifiable ones are dropped.
„Keine Unterlagen nötig?“
DE · static- Hook
- Question
- Visual
- Illustration
- Emotion
- Relieved
- Awareness
- Solution named
- Sophistication
- Claim
- Angle
- No paperwork
Generate
What should we make next?
Variations on winners and fatiguing creatives, and new concepts for open territories — briefed from what is proven, trending and still uncovered.
Average for a variation on a proven direction; new concepts take longer. That speed is what makes 200–250 new creatives a month realistic.
Test & scale
What’s winning — and what’s about to fatigue?
Reports turn decomposed data into decisions: top performers, creatives at risk, trending and proven elements, competitor moves, voice of customer and coverage gaps.
The brief pulls it together — volume needed vs produced, what works per direction, team hypotheses checked against data. Results feed the next turn of the cycle.
Three hypotheses. One turn of the cycle each.
Proven hooks, real people
- Signal
- Hooks already working in statics, personas competitors used that Finom never covered, and what customers say they need — from voice of customer and reviews.
- Insight
- A proven hook doesn’t need reinventing for video. It needs a person and a situation the viewer recognises.
- Test
- Real business owners in their own workplace — office, workshop, café. The product shows up only after the situation is set.
- Next
- Winning AI UGC scripts become briefs for real creators; hook and structure kept, context localised per market.


From under 5% to a quarter of the portfolio.
Video was under 5% of live creatives and above target CAC, while competitors in the category run 30–45% video. Instead of dropping it, video was briefed from hooks already proven in static, then new formats and angles were tested.
Every ad set that scales now carries both formats.
Sell the relief, not the product
- Signal
- A “stress-free” credit ad outperformed everything around it.
- Insight
- Decomposition showed the lift came from the relief framing, not the product. A concrete number up front worked the same way.
- Test
- Both framings carried into business IBAN and everyday banking — headlines, visuals, secondary copy.
- Next
- Relief moved into the visuals, then to NL and into video.
in DE
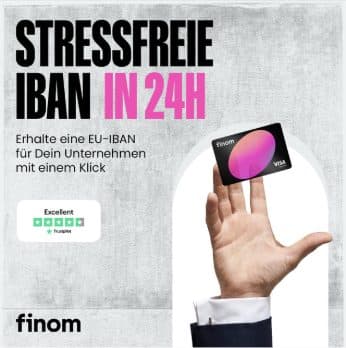
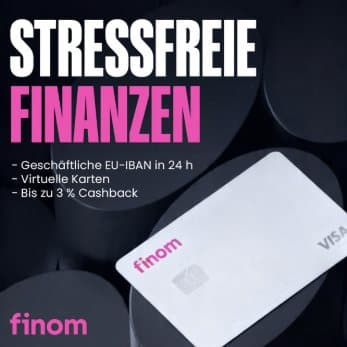
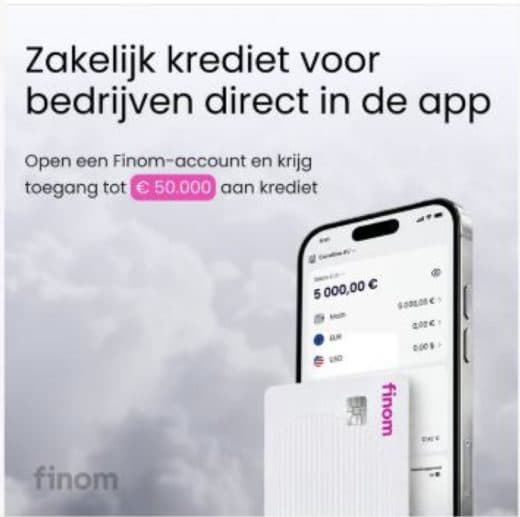
Simple, bright, with people
- Signal
- Meta AI creative recommendations, plus the competitor audit: 67% of competitor creatives frame a card or a phone, a third on dark backgrounds.
- Insight
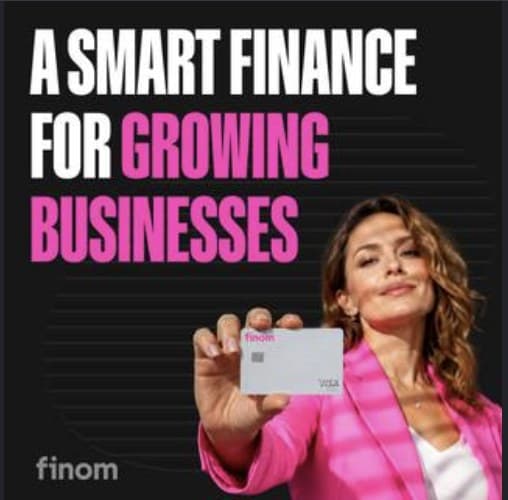
- The category looks the same. Real people read as less of an ad.
- Test
- Bright, simple visuals with real people in real workplaces, short direct copy, product after the context — all within Finom’s brand guidelines.
- Next
- The same visual rule became the base for AI UGC video.
in SME Germany
(English version)
Not budget — a creative cycle that keeps volume precise for every region and segment.
of creatives become top performers
and carry about 80% of spend
unique creatives live at any time
each with a reason to exist
See what Loudbox finds in your creatives.
We’ll run the first turn of the cycle on your brand: what’s winning, what’s about to fatigue, and where competitors speak and you don’t.
Also available as a plugin
for Claude and Codex
All figures are relative. Absolute budget, account volume and acquisition cost are withheld by agreement with the client. Creative-level data uses CRM attribution, post-view and post-click, over each creative’s full lifetime.